Dow Jones made a higher closing but it was on light volume so it is still bearish in the short term. Now waiting for it to test the resistance of 13257.
Dow Jones Industrial Average Chart:
There were 2 downside gaps on the STI chart near 3212 and 3352. The downside gap of 3212 was closed on Monday but the downside gap of 3352 was not closed. STI tested and attempted to close this gap but failed to close it and this is a sign of bearishness.
Another thing was that today's closing was a black candle with low volume and that is a bullish sign actually so i am taking note of it. But meanwhile everything else still looks bad on the charts.
Straits Times Index Chart:
If u notice carefully on the charts, the same story has been repeating over and over again for the past one to two months.
1. Index fail to make a new high or break it's resistance
2. It den fall back to next level of support
3. It may hover around support or attempt to rally up but any rally was weak which was confirmed by light volume
4. It fell through support and land on the next support
5. Step 3 repeats again
A few charts caught my eyes today. The 1st one is DMX Tech. I been monitoring it for a few months already. It's interesting cos i never seen such huge divergence before. Look at how the A/D line is trending upwards at an exponential rate while the price action just keeps falling ! I visited some forums and i think there are some rumours of a takeover by other company. Maybe that explains it but it does not matter cos price action always precede news.
DMX Tech Chart:
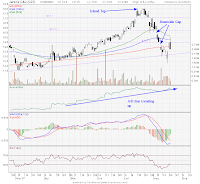
The next one would be Jardine C&C. It caught my attention cos i saw it in the top price movers list. Well these days, banking stocks keep hogging this list so when i saw this, i tot i better make a chart of it for my observation.
Bascially it had 2 downside gaps and it is attempting to close the 1st downside gap but it failed to close it, forming a bearish engulfing pattern
Jardine C&C Chart:
Tuesday, August 21, 2007
Rebound halted
Posted by
Kay
at
8:53 AM
![]()
Labels: DJIA chart, DMX Tech, Dow Jones, Dow Jones Industrial Average, Jardine, STI chart, Straits Times Index
Subscribe to:
Post Comments (Atom)


0 comments:
Post a Comment