
By the Dow theory, a higher high and a higher low is confirmed for the Dow Jones thus an uptrend is still in place despite the dips recently. I believe DJIA should rebound off from it's current level technically.
DJIA has tested the 200d MA and has successfully close above it for the past 2 closings. Furthermore, the formation of a doji candlestick suggest that a short-term bottom has been reached. Moreover, DJIA now lies on a trendline that was drawn connecting the prior two higher lows thus i believe DJIA will not dip anymore beyond this level technically.
Dow Jones Industrial Average:
What is being said for the DJIA is different for the STI. The Straits Times Index tested the 200d MA on thursday and failed to close above it and i consider that to be bearish. Notice that this also rebounded off the resistance trendline drawn connecting the prior two highs. There was a prior small gap up which will act as a support technically so there is a chance that STI will dip til this level. However, for both the DJIA and STI, the trading volume still remains light overall.
I am still bullish overall going by the charts and if one still believes that the DJIA is a leading indicator of the STI.
Straits Times Index:
Saturday, December 29, 2007
Weekend review of STI and DJIA
Wednesday, December 26, 2007
Rally led by retailers
Dow Jones broke above the 200d MA and along with the other MAs used in my chart, namely the 50d and the 100d MA and that is a bullish sign. Next resistance will be the prior peak level around 13767. Overall, it's a good sign that DJIA is finally recovering.
Dow Jones Industrial Average:
I do have more observations on the Straits Times Index. STI is still below the 200d MA but given that DJIA is now above the 200d MA, STI should be testing it soon subsequently. Next resistance level will be the prior peak level which is at around 3621. A breakout above this resistance will result in a double bottoms formation technically.
Today's trading volume was exceptionally light though it was a full trading day. The 2nd last closing's volume was light because STI only traded for half a day. This would mean that the rally was led by the retailers and the funds are still not back yet and that does not sound very good to me. I can't predict when will they be back though most speculate that they will be back after the new year. However, it will be reflected in the chart technically.
Straits Times Index:
Anyway, congrats to all those who bought near the November prior support level. That support level held and those who had bought den should be sitting on some profit buffer now :)
AdvSCT caught my attention on my list of charts. The level of $0.935 is an interesting level. Notice that there were 2 prior gaps up on the chart at this level thus they are acting as a support at this level technically. Furthermore, the level of $0.935 was tested successfully as a support level by the candlestick tweezer bottoms. This level should be safe to buy in.
AdvSCT:
Sunday, December 23, 2007
Weekend review of STI and DJIA
This post will be a very simple one. The Dow theory worked relatively well in the previous corrections though by the time it is confirmed, it is a bit late in catching bottoms. Rather it can be used to confirm bottoms. A higher high and a higher low will confirm a uptrend and a lower high and a lower low will confirm a downtrend.
For the Dow Jones, it can be seen from the chart that a higher low has been confirmed. Going by how it pierces the peak of the index action, a higher high has also been confirmed thus this implies that a uptrend is in place. Notice that the latest closing was done with heavy volume.
Dow Jones Industrial Average:
For the Straits Times Index, a slighter higher low has been confirmed and a higher high is also in the making. Thus this should signifies a uptrend is taking place.
Straits Times Index:
Friday, December 21, 2007
Analysis of some counters
It's weekend again and christmas is coming. Seems to me that the market is bullish today as a lot of counters rallied.
Yangzijiang rallied up today with heavy volume and that is a good sign. Furthermore, there is bullish divergence in the RSI. Notice that the $1.86 level proved once again to be a crucial support technically as it bounced off from here. Next resistance will be the confluence of the 50d and 100d MAs and the prior top of $2.19. A breach of the $2.19 resistance will result in the formation of double bottoms.
Yangzijiang:
ChinaAOil has been in my watchlist for a long time. Notice from the chart that the level of $1.97 has been a strong support technically and it seems to have test the support successfully this time too. However, the volume seems low today so i guess it's better to observe further.
ChinaAOil:
Dow Jones haven close yet as of now so i will be posting on what i think about the indices tomolo :)
Wednesday, December 19, 2007
STI taking a break
A lot of counters tested their November lows today again and some of the counters did not make it this time round. However, it seems to me that the STI is holding well at the support level mentioned in my previous post.
Yangzijiang seem to have broke it's strong support of $1.86. It closed at $1.85 today so it might be prudent to wait for the next closing to confirm that the support has been breached.
Yangzijiang:
China Hongxin broke the 200d MA and the trendline and that is extremely bearish. I placed a long today, only to see it breach it's support level during the day to my surprise. So in the end, i got out by taking a small loss near the closing. I believe this counter should plunge all the way down and it is a prime candidate for shorting.
China Hongxin:
Tuesday, December 18, 2007
A Merry X`mas indeed ?
Yesterday, i saw the Dow Jones broke the 200d MA and i tot that was ominous enough. To my surprise, STI and HSI did not plunge further but STI rallied instead. Now as i am looking at the Dow Jones, it opened on a gap up. I must say i was quite taken aback since usually Dow leads the HSI and STI and now the vice versa has happened.
STI was supported on the previous support level made in the Nov correction. Today's volume was heavier den the previous down days and that is good. That is a good chance that it may hold at this level.
Straits Times Index:
Today, a lot of counters tested their November correction level successfully. This represent a good chance to enter at a good reward to risk ratio. Nothing is absolute in any analysis so if this November correction level fails to hold, it will be time to get out to limit losses. Below are some counters which are at a strong level of support.
China Hongxin is supported on the 200d MA and a trendline that goes all the way back to March. Notice that this trendline has been tested 4 times successfully and these are signs of a valid and a strong supportive trendline.
China Hongx:
For the STX PO, the level of $2.59 has been a important level. It started off as a resistance level in July before this resistance became a support level in Sepetember and November. It tested this level successfully today. However, this is a very volatile counter as it can move up and down a lot of bids in a single trading session.
STX PO:
Monday, December 17, 2007
Downtrend continues
Dow Jones broke the 200d MA on the latest closing and that is very ominous. It closed with a nearly shaven long black candlestick.
Dow Jones Industrial Average:
The Straits Times Index covered back the previous gap down with another huge candlestick and that is bearish. There are some important support area that is going to be tested soon. They are the previous dip made in november and the orange trendline.
Straits Times Index:
I spotted Celestial testing a very important support level of $1.03. Notice this level has been tested successfully thrice and it stretches all the way back to June last year. At this point of time, it is testing this level so we shall see how it goes.
Celestial:
I just sold off my position at a small loss. Right now, i will be taking a break of few days cos my mind and my heart is not ready to look at any charts. Guess it is better to stop and reflect on my mistakes den to plunge straight in and make more irrational decisions. For a start, it's been very tiring to hold on to my losing position and i should have gotten out earlier. Now i will just wait for the market to bottom before picking up counters at their succesfully tested support levels.
Saturday, December 15, 2007
2nd STI and DJIA weekend review for Dec
It's been a turmoil for this trading week and to be honest, i did not expect this to happen. I din think it will retrace so badly but i guess i gotta change my mindset and go with the market.
The Dow Jones suffered a huge drop on the latest closing and the volume was significantly heavy. It closed near it's low but notice that it closed around the level of the previous two lows. Currently it is near the 50% fibbonacci retracement level and it will be testing the 200d MA. Short-term wise, the current level should hold but it is always prudent to wait for it to bottom out.
Dow Jones Industrial Average:
It's a bad week for the Straits Times Index. It breached the 200d MA and covered back one of the previous gap down. The support trendline for the RSI has been broken. The next level of support will be an another previous gap down as gaps can act as support.
Straits Times Index:
Monday's opening for the STI will be a gap down for most counters due to DJIA's poor closing. It's a reminder not to buy so early as i can see in the CNA forum that quite a lot of people got vested in the previous 2 days. It is better to watch for signs of reversal technically like the easing of selling momentum and the drying up of volume though volume has been very low recently.
I have learned a lot from my recent position in Yangzijiang and i think my lack of experience is starting to show. I took up a position after deciding technically that a bottom has been reached in the middle of November. Indeed, i was correct in calling for a bottom. I actually had a chance to take a 10% profit in Yangzijiang. For my other buy calls such as China Hongxin, there was a chance to take a profit of around 20%. But i din sell as i wanted to ride the trend. But alas, i should have taken a profit even though it's small cos the market is still volatile and this is where my lack of experience is showing. Decipher did that when he took his profit off the market as he knew that the situation now is not suitable for riding on the trend and i respect him for doing that. That's the difference between someone who has more experience den the other.
Furthemore, i am expecting myself to take a 20% profit before liquidating my position so when that did not materialize, i did not liquidate but stubbornly held on to my position. Now i know well that it is better not to expect anything but just see the situation first before deciding rather den hang on to the notion of wanting to have a profit of 20%. The market is not my ATM. If it gives me this much, i should just take it.
On thursday, the closing fell below the channel support but i still held on stubbornly in the hope that it will bounce back. The next day which was Friday, there was a chance for me to sell off during the opening when the price reaches it's high of the day but i still held on in the hope that it will rally somemore. In the end, the closing was lower den the opening and i lost a good chance to liquidate. I should have been disciplined enough and sold when the channel support is being breached. Anyway this happened to my previous stops too so i must change my mindset and sell the moment the technical signals suggest so instead of waiting for a while.
On Monday, i will be exiting my position with a small loss. It is frustrating when u see ur profits turn to loss but i guess i got no choice. But at least i do learn something from this. I think i will be taking a break of few days from the market to sort out my mind and my psychology. Meanwhile i will be sidelining until i can see the technical signals for a trend reversal is back. There is no point in forecasting since one cannot be absolutely sure. It is better to ride the trend when the trend is back.
For a sidenote, Yangzijiang is a very good fundamental stock. Notice it is one of the new stocks to be included in the revamped STI which i think will be used starting from the 8th of Jan for next year. For now, the overall market volume is low simply because the funds are not back yet. So far, those stocks which are removed from the revamped STI has been sold already. I am wondering when they will buy back. Thinking from their point of view, i will probably let the price action dip even more to let retailers dump their holdings out of fear. Then i will come in and accumulate watever they dump at a cheap price. I think maybe my view is too simplified so comments will be appreciated :)
It is not easy to be a good trader or investor. Success requires hard work and to be able to learn from mistakes. Still got a lot of stuff to learn but i believe i will be there someday. I would end this post with a quote,
"When u start to pray and hope, u will lose"
Wednesday, December 12, 2007
Buying momentum still not back
Today was a pivotal day as we observe the impact of the outcome of the Fed meeting. Apparently, the rate cut was not enough and the markets opened with a gap down.
The Dow Jones closed with a huge black candlestick and landed on the 100d MA thus the 100d MA is the support for now.
Dow Jones Industrial Average:
The Straits Times Index opened with a gap down but managed to close higher den it's opening with a small white candlestick. However, it is noted that the volume is still very light.
Straits Times Index:
It seems that what i hoped for did not come true in the end. The Fed meeting did not bring back the buying momentum because the rate cuts were not enough. This can be seen in the extremely low volume for the STI today.
Overall, i am still bullish cos technically speaking, the uptrend for both the DJIA and the STI is still intact. In fact, i think today is a good day to load up simply because due to the rate cuts, the market is grossly oversold today. Furthermore, though most counters opened with a gap down today for their openings, the selling did not persist and most counters regained some ground. This shows that there are still buyers out there. I guess i just gotta have some more patience to hold on.
IndoAgri seems to be looking bearish. Currently it is now supported on the trendline but both the MACD and the RSI are showing bearish divergences as they trend lower while the price action still trends higher. Furthermore, it seems that the volume overall is drying up as seen in the yellow region as we compared to it's previous rallies where there were huge spikes in the volume. If Indoagri breaks this trendline, chances are that it will plunge further.
IndoAgri:
On a lighter note, i realised i made some mistakes for my weekly charts. For the period parameter of the RSI, i should have use 8 or 9 weeks instead of 14 weeks. It is no wonder that my weekly RSI lines were so smooth :) After changing it to 8 weeks, the RSI seems much more useful as i spotted bearish divergences just before the previous few corrections. Those bearish divergences were not present when i set the period to 14 weeks. I set it to 14 because on the daily chart, i use a period of 14 days thus it din occur to me that i should change it to 8 or 9 until i reread my technical analysis books. Think i should tweak my MACD parameters on the weekly chart. That solves the great mystery on how come i think that the RSI is so useless on the weekly charts :D
Monday, December 10, 2007
Players watching by the sidelines
Today's volume was very light. I woke up just before noon and saw that in the top volume list, majority of the counters did not even hit 10k in their trading volume. I guess that a lot of people are sidelining the market.
Quite a lot of counters dip today and the dip was quite significant. What was strange was that the dip was on very low volume and that showed that there were very few buyers to push back the price. It was only during the end which some of the counters recovered back some ground. I'm not that worried about the dip cos it was on low volume. The market's sentiment now hinges on the outcome of the Fed meeting so it's quite pointless to discuss anyting until the outcome is revealed. One may take a bet now and place a position in the market or just sideline and watch the show :)
For the Straits Times Index, it formed a hanging man candlestick today which is bearish by nature but overall, it is still supported on the 100d MA.
Saturday, December 8, 2007
STI and DJIA weekend review
Dow Jones tested the 61.8% fibbonacci retracement and failed to close above it. A break above this retracement level will mean that the DJIA will probably go all the way north to it's October's peak. Furthermore, it has broken the trendline that i drawn which connects the previous 2 peaks and that is a good sign. Overall, things are still going well on the charts.
If the DJIA should retrace, it is likely to land at the area of yellow region highlighted in my chart and that is due to the 100d MA and the current channel support in the yellow region.
Dow Jones Industrial Average:
For the Straits Times Index, it found support on the 100d MA. It is still some distance away from the trendline that i drawn connecting the previous peaks. Given the DJIA has broke that trendline, i think STI should break this trendline soon.
Straits Times Index:
Overall, i feel that the markets is definitely not as volatile as the previous 1 to 2 months ago. Things are starting to look much more predictable and boring perhaps though i would say the buying momentum is still not back yet. I hope that the outcome of the Fed meeting will bring back the buying momentum to sustain the end of the year rally. I noticed in my charts, most of the counters have rebounded off their support already but are still some distance away from the resistance levels thus buying on breakouts of resistance is still a risky move.
Meanwhile, there was some news released over the weekend that China raise their reserve ratios and the implications of it is that the s-shares will take a dip on Monday. For a start, i dun buy on news but rely entirely on technical analysis only. Maybe that piece of news explains why some of the s-shares in my charts open on a gap up but covered back their gaps and close below their gap for friday's closing which i tot that it was pretty surprising given DJIA's strong closing on thursday. Perhaps this is yet another example of price action comes before news :) If i were to buy on news, probably it will be too late since there are definitely some privileged individuals who knew of this piece of news before the general public knew it and started to dump their shares before the weekend.
Friday, December 7, 2007
Yangzijiang's progress
Yangzijiang is looking good for it's uptrend. It tested the prior gap up made 3 closings ago with light volume sucessfully today. Furthermore, the gap up coincide with the 100d MA and these 2 factors suggest that the gap acts as a strong level of support. The next resistance will be at $2.29 and that will be the target price. We should see this being reached by the next Fed meeting if rates are being cut. With some luck, it may even breakout from the $2.29 level :)
Yangzijiang:
Wednesday, December 5, 2007
Rain doused off the bears
Today's rally was a surprise to me given that the Dow Jones din move much at all for the past few closings. I guess somehow the heavy rain today made the bears all went into hiding as the STI rallied strongly today :D
For the rally today, STI tested the 100d MA again and failed to close above it. The last test was 3 closings ago. Notice that the 100d MA is near the level of the previous gap down so this forms a level of resistance. Furthermore, the combination of the last 3 candlesticks formed a tweezer tops and currently, i would establish the next level of resistance that is to be broken to be around 3580.
I dun think it's much of a problem since STI has already formed a higher high and a higher low. By Dow theory, this signifies a uptrend as stated in my previous posts.
Straits Times Index:
Asia Env has finally covered the gap down made in late july at around $0.80. That in itself is a piece of bullish news. Today's closing was strong as it closed with a long shaven white candlestick with heavy volume. This counter has been in my watchlist for the past one or two months when it showed bullish divergence with all the 3 technical indicators that i used when it was at around $0.675.
Asia Env:
Another surprise for me was that Golden Agri breakout against it's resistance trendline ! It really took me by surprise as i reckon that technically speaking, it should head south in my post yesterday. I must admit i made a bad call for this counter although i dun think my analysis is that flawed . Well as i always like to say, the market is always right and opinions can be wrong so my opinion is wrong this time. If u have a 2nd opinion about this counter or if u wana point out any mistakes i made, u can drop me some comments in the shoutbox to help me out :)
Golden Agri:
Tuesday, December 4, 2007
Kiss of death for Golden Agri
I spotted a classic chart today and that is Golden Agri. This counter has been trending upwards very well along with Wilmar and IndoAgri for the past one or two months. We can see in late Oct, it broke out of it's channel resistance and this resistance trendline turn support subsequently. It broke this support trendline 3 closings ago and today it tested this trendline as this trendline changes from support to resistance. U can see how this counter tested the trendline by forming a 'wick' on the candlestick and that's what i call as the kiss of death. Furthermore, the volume was very light today. So technically speaking, this counter is likely to head south.
Golden Agri:
For indices-wise, everything is going as i expected. Currently there is no retracements and it has been closing flat for the past few closings. We should see some movement soon.
Sunday, December 2, 2007
Recovery of the STI
As an overview, the market have seem to recover from this current correction. Both the Dow Jones and the STI showed signs of recovery as they tested their support levels.
DJIA tested the 200d MA on the last closing and managed to close above it and dat is a good sign. Although the candlestick dat is formed is a hanging man which is bearish going by candlestick charting, i think overall it is bullish because DJIA broke the 200d MA on thursday and the latest closing confirms that the DJIA is able to stay above the 200d MA. Furthemore, there is a MACD crossover and that is bullish.
Dow Jones Industrial Average:
STI showed bullishness as it gapped up for it's previous 2 openings. The volume for the last closing was very heavy and that is a good sign. Furthermore, there is a MACD crossover which was similar to the DJIA. Next resistance for the STI will be the region around the 50d and 100d EMA which happens to coincide with the 38.2% fibbonacci retracement.
Straits Times Index: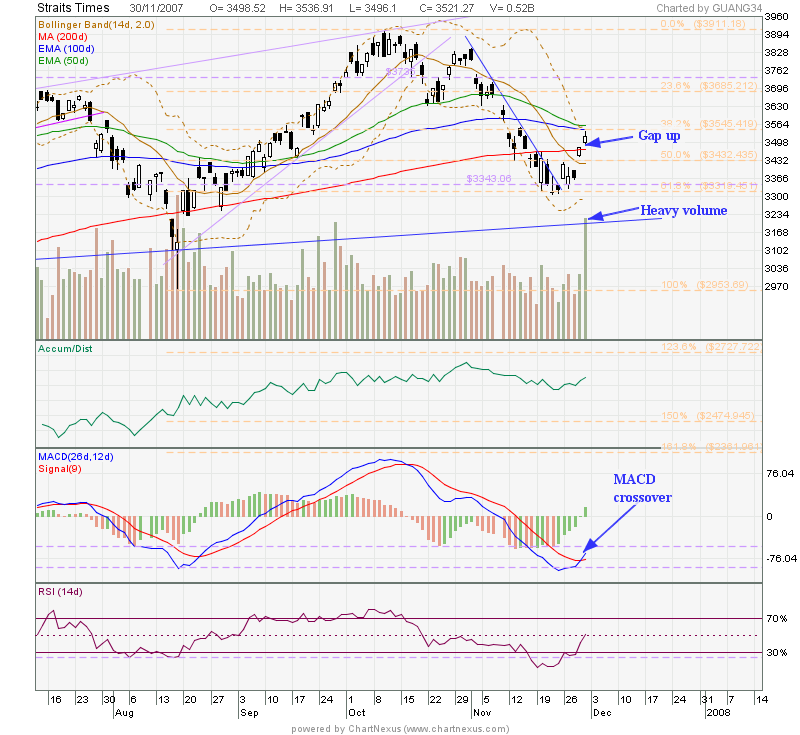
Overall, i believed that the market have bottomed out last week as they tested their previous support levels successfully. A lot of charts in my watchlist dipped to their support levels and they managed to hold their supports and some of my charts which had a double tops formation turned out to be a bull trap as they failed to follow through their formation. Last week was a good week to load and hold counters for the short term and it is time to go long.
China Hongx is now near their support level. This support is especially strong since it falls on a trendline which has been tested 3 times so far and the 200d MA. This will be a low-risk counter to load in.
China Hongx:
Yangzijiang tested the $1.86 level three times with relatively significant heavy volume and it closed above this level thus this level proves to be a strong support. Currently it is forming a triangle formation and it showed bullish divergence with the MACD and RSI technical indicators. We shall see whether these indicators work well :)
Yangzijiang:
Wednesday, November 28, 2007
Moving nowhere for a while
The market seems to have establish some kind of support level as of now. For the Dow Jones, basically it tested the level of around 12740 twice and this level will act as the support for now. It closed with a rally on the latest closing with significant volume and that is good.
Dow Jones Industrial Average:
For the Straits Times Index, there was a upside gap 3 closings ago and this gap was tested sucessfully in the sense that it did not close below the gap and dat is bullish. One thing that puzzle me was that though DJIA rallied up on the latest closing, STI failed to close up higher. But as of now, STI has established a support level with the tested upside gap.
Straits Times Index:
In my humble opinion, i reckon selling pressure or the momentum have eased off already. STI fails to move up cos there is no buying pressure as the sentiment is still mixed. So what can change the sentiment of the market and that is, to convince people to be buyers again ? That will depend on the outcome of the next Fed meeting which will be coming soon in Dec. That outcome will be reflected in the charts by the index moving north and that is if the Fed cut their rates. Hopefully, if they cut their rates, buying momentum will resume and i can start to ride the trend again.
Tuesday, November 27, 2007
Another formation failure
Bio-treat formed a confirmed double tops and it should be going down south. But today it rallied up and broke it's previous support line. Another stark reminder of formations do fail and one should have a cut loss principle in place. There is much more to technical analysis den just formations.
Bio Treat:
Monday, November 26, 2007
STI forming a channel resistance breakout
Actually the above title is not surprising. Like what i mentioned in my previous posts, if Dow Jones fails to break it's channel resistance, there is no way STI will break theirs. So DJIA has broke out of it's channel resistance so thus, it is only natural for STI to broke out of their channel resistance.
Today's closing was quite good. Opening was by the retailers since STI increase quite significantly at the opening and only increase slightly towards the end of the day. Volume done was quite significant though not that heavy. Whether this will translate to the next bull run, i am not sure though the breakout of the channel resistance is quite a piece of good news. Next technical signal for uptrend of the index will be to look out for a higher high and a higher low to be formed before i will go long.
My opinion is that since all bad news have been released and has been discounted in the charts, this shld be the end of the correction unless more new bad news is being released. However, time and time again, opinions can be wrong and the market is always right so i will just follow the market. It is almost impossible to try to catch the bottom so i am in no hurry to catch the bottom. I will be keeping my fingers crossed. We shall see whether a higher high and a higher low will be formed in the next 2 weeks.
Straits Times Index:
Sunday, November 25, 2007
Additional opinion on the Dow Jones
I took another look at the weekly chart of the Dow Jones Industrial Average today again. The weekly chart is more important den the daily chart technically. It seems to me that there is a chance that this correction may be over.
Dow Jones seems to be supported on the previous resistance now. On the latest closing, it tested this previous resistance turn support level with a hammer like candlestick so i am slightly more bullish now. Let's see whether this support will hold.
Dow Jones Industrial Average Weekly:
Saturday, November 24, 2007
Another likely technical rebound for STI
The closing on Friday for the Dow Jones was interesting to some extent. There were 2 important technical factors that can be gleamed from the chart. The first would be that DJIA form a breakout of the channel resistance. DJIA has been trending in this downward channel for the past month and a breakout of the channel resistance seems to be a piece of bullish news.
However, if one takes another look at the volume, u can see that the volume was extremely light. For this closing alone, volume does not confirms index action thus the rally was not a 'true' rally.
If we looked at the previous drop in Aug, we can see that there was a hammer formed with an extremely long tail. I browsed through the CNA forum and some of them shared that on that day itself, there was panic selling so the index dip til a very low level. The funds took advantage of this and decides to load in at a cheap price and that explains the very long tail and the heavy volume. So right now, i guess this is not happening. I am not suggesting that history will repeat itself but if this happens again, it can serve as another sign that a bottom has been reached.
Since the volume was very weak for the latest closing, i will wait for another closing to be sure.
Dow Jones Industrial Average:
I think there is no doubt that STI will rally on monday. That is because DJIA rallied on friday albeit with extremely light volume thus STI will follow the DJIA. The threads in the CNA forum are always a good indicator to gauge the market sentiment. I noticed that the market sentiment for the retailers are bullish thus the rally on monday for the STI will be led by the retailers on the opening. STI may break it's channel resistance too on Mon. Whether the funds will start to buy in, i guess we gotta observe further.
Straits Times Index:
My CFD account is finally ready and i can short counters now but it may be too late. The next best opportunity will be that DJIA fails to hold it's previous support level in Aug. This will cause the STI to break it's support of 61.8% fibbonacci retracement level. Once a index or counter break this retracement level, there is a high probability that it will do a 100% retracement. But i think that this is not likely to happen. It seems to me that all the bad news are being released already and have been discounted in the index so i dun think the chances of this happening will be great. Monday will tell us whether the breakout of the channel resistance was valid. If it is not valid, both DJIA and STI may tank and this may be a good chance to short.
Bio Treat formed a double tops on Friday and it was confirmed with a gap down and a shaven black candlestick. I think it should decline even more in subsequent closings but i guess it will take quite some time.
Bio Treat:
Wednesday, November 21, 2007
Downtrend of the market continues
It is noted that there were 5 attempts for the Dow Jones to break the current downtrend channel resistance but all attempts were futile. The downtrend is still continuing. DJIA is going to reach a pivotal point soon where it will test it's previous support level on 16th Aug. Den we shall see whether DJIA will rebound off this level.
I think i kind of given up hope on technical indicators. Or rather, maybe they dun work well for this situation. There were positive divergences signs on the technical indicators i used. A/D line is showing bullish divergence in the long term and RSI refuse to head south despite the drop in index action. But i have been seeing this for quite some time already but the index still refuse to head north. Now we have the MACD lines piercing the previous support level and this implies selling momentum is still going on.
Dow Jones Industrial Average:
The chart of the Straits Times Index mirrors the DJIA. If DJIA fails to break it's channel resistance, u can see STI has no chance of breaking it's own channel resistance too. Currently it is supported on the 61.8% fibbonacci retracement. I drew the retracement wrongly but the level of the lines for the fibbonacci retracement levels are still correct. If it falls below 61.8%, it is likely STI will retrace all the way. It is noted that the RSI is way too oversold already but RSI can remained well oversold in a trending market as it does not work well in a trending market.
Straits Times Index:
So my conclusion is the downtrend is still continuing. All depends on DJIA. Currently, it can't even break it's channel resistance so i reckon the bull is still sleeping in the market and hiding somewhere.
I decided to review the 2 counters that i posted last week.
Bio-treat did not took off as expected since the market sentiment is still bearish. Now it is back at it's previous support level.
Bio-Treat:
Asia-env is showing a lot of strength. Everytime it tries to head south, there will be buying coming in and this can be seen in the tails being formed in the numerous candlesticks. Notice how it can rally up despite the current bearish market sentiment. Price action confirms all 3 bullish divergences in technical indicators.
Asia-Env:
AdvSCT formed a rising bearish wedge and it was confirmed when it broke the support trendline. I tot the chart is quite nice so i gonna put it up. After all, it is not everyday that i get see a wedge formation.
AdvSCT:
One of the gurus in the channelnewsasia rallyartist's thread shared with us a great insight into reits. I am gonna just post it below.
something to share about investing in reits. reits is a long term investment instructment. as the price get rammed down, the yield becomes more attractive. in STI market, the average yield is 5% for reits, which is pretty much better than CPF special account interest rate and of course FD rate. note long term i mean time frame of at least 10years. in general reits are defensive stocks as they are backed by the phsyical asset they own. the "correct" way of investing in reits is buy a portion first, get the dividends and reinvest back the dividend to buy more of the reits at lower price. STI market has been very nice to reits investors as many just treat reits like normal stock, play it up and play it down and this has given reits investor always the opporuntiy to buy at lower price. average down on reits is nothing wrong.
as you compared the current price of reits now and perhaps 6mths ago, 6mths ago, it was like only a handful of them are giving a yield of at least 5%, perhaps like 40% of the total reits only. at current price, it is like 70% - 80% of the reits now are able to fetch you at least 5% in term of yield.
some ask what to do in stock market when bear market starts, if you are vested in reits, those good one, in bear market you will be still getting dividends. this is the good thing as compared to normal stocks whereby come bad times, companies no earning, where have dividend for you; exception of defensive stocks like sph.
similarly for funds, come bad times, they will be vested in defensive stocks with good dividends so that they have something to give to their clients.
i suppose many need to tune their mindset to "real" investment in order to survive a bear market if it really comes. in bear market, even you holding lot of cash also no use, put in the banks, what type of rate you can get ? might as well dump into defensive stocks and get the better dividends as compared to putting in bank for that peanut interest.
i also need to stress is that for reits, price appreciation is not a primary factor but rather the dividend yield is.
I opened my CFD account today and i am ready to short soon. But in view of my impending exams, think i wun be exercising this right so soon. Gotta concentrate on my exams !
Sunday, November 18, 2007
Oscillating like a wave
Dow Jones rebounded off it's channel resistance for the latest closing. The weak rally on friday failed to breach the channel resistance line. Furthermore, it tested the 200d MA but failed to close above it. Now i guess Dow Jones will rebound off it's channel support line in a few days time but as of now, it is still quite far away from the channel support so Dow should decline further in the next few days.
Dow Jones Industrial Average:
As what i mentioned in my last few posts, the chart of the Straits Times Index look almost like the Dow Jones, except that it seems to be lagging a bit. So if Dow Jones rebounded off it's channel resistance, chances are that STI will decline in the next few days until it touches the channel support. As of now, we can see from the chart that the STI has rebounded off it's channel resistance.
Straits Times Index:
It's a good time to be go short indeed. I notice most of the china stocks have breach their support and are falling like there is no tomorrow. I guess it's time for me to enquire more about CFDs and open an account to take advantage of the situation.
Thursday, November 15, 2007
End of technical rebound
Dow Jones bounced off it's channel resistance yesterday night. This means that the rebound is only a technical rebound and not the start of a bull run. Next possible action is that the Dow will head back towards the channel support. Since Dow closed badly, i believe STI should also rebound off it's channel resistance today.
It feel almost eerie that the simple concept of trendlines work so well at times. I drew the blue line connecting the previous 2 tops of this current downtrend. It's such a strange thing that the Dow Jone rebounded off this line after it touches it as if that Uncle Dow knows that it must rebound off this line dat i have drawn :p
Dow Jones Industrial Average:
Tuesday, November 13, 2007
Technical rebound has arrived
I wanted to post yesterday night but i had problems putting up the charts with Blogger yet again so i din post. But i guess it was good in some ways as i can blog about the technical rebound for the latest closing of the Dow Jones.
The Dow Jones rallied strongly last time with by rebounding off it's channel support with a long white shaven candlestick with heavy volume. The technical rebound which i have been expecting has arrived finally. The technical indicators have already suggested that a rebound will take place soon since the MACD histograms and lines have touched the prior levels and the RSI seems to be showing bullish divergence as it has been trending sideways while the index suffered a huge drop.
Dow Jones Industrial Average:
For the Straits Times Index, it should be supported at it's current level due to the confluence of the 200d MA and the fibbonacci retracement level of 50%. These are some of the strongest supports that are used in technical analysis. Furthermore, the MACD histogram have now touched the prior correction level.
Straits Times Index:
Even though the technical rebound is here, this may not spell the end of the correction. Both the Dow Jones and the STI may rebound off their channel resistance so we gotta see what will happen subsequently. Only a higher high and a higher low in index action can confirm that a uptrend is back in place.
Currently i am looking at a few counters. These are asia env and bio treat. These counters are not likely to rally up a lot since they are not in play. What attracts me is that despite the 3 dowm gaps that the STI has suffered for the past few days, these counters dun seem to display a gap down and is still maintaining a sideway trend. Furthermore, they are showing bullish divergences with their technical indicators and are now both supported by trendlines or their previous support level.
Asia Env:
Bio Treat:
